Abstract
When clustering images, the images are typically sampled as nonlinear manifolds. In this case, local learning-based image clustering models are used. Several proposed clustering models are based on linear discriminant analysis (LDA). In image clustering based on linear discriminant analysis (LDA), the problem of small-sample-size (SSS) is presented when the dimensionality of image data is larger than the number of samples. To solve this problem, various image clustering models based on local learning have been introduced. In the proposed clustering models, we added tuning parameters to deal with the small-sample-size (SSS) problem arising in linear discriminant analysis (LDA). In this paper, we propose an exponential regularized discriminant clustering model as an image clustering model based on local learning. In the proposed local exponentially regularized discriminant clustering (LERDC) model, the local scattering matrices of the regularized discriminant model are projected into the exponential domain to address the SSS problem of LDA. Compared with previous clustering methods based on local learning, k-nearest neighbors and regularization parameter λ in the local exponentially regularized discriminant clustering model are the tuning parameters for clustering. The experiments are concluded that the clustering performance of the proposed LERDC model is comparable to that of the clustering methods based on previous local learning.
Keywords
Image Clustering, Discriminant Analysis, Local Learning
1. Introduction
Cluster analysis is often used to process and classify images by computer as well as classification of data in various scientific fields
| [1] | Adil, M., Abid, M., Khan, A, Q., et al. Exponential discriminant analysis for fault diagnosis [J]. Neurocomputing. 2016, 171, 1344-1353. |
| [2] | Zhu, J., et al. Distributed parallel PCA for modeling and monitoring of large-scale plant-wide processes with big data [J]. IEEE Transactions on Industrial Informatics. 2017, 13(4), 1877-1885. |
| [3] | Yu, W., Zhao, C. Sparse exponential discriminant analysis and its application to fault diagnosis [J]. IEEE Transactions on Industrial Informatics. 2018, 65(7), 5931-5940. |
[1-3]
.
Image clustering is a method to optimally partition images so that image data points belonging to the same group are similar to each other and not to image data points belonging to other groups.
In many fields, data are generally high dimensional, so to process high-dimensional data, the dimensionality of data must be reduced.
Linear discriminant analysis (LDA) is a well-known method for dimensionality reduction.
In
| [4] | Shuiwang, Ji., Jieping, Ye. Generalized Linear Discriminant Analysis: A Unified Framework and Efficient Model Selection. IEEE Transactions on Neural Network. Vol, 19., No, 10., October, 2008, 1768-1782. |
[4]
, a model selection algorithm for PCA+LDA and RLDA (regularized linear discriminant analysis) is proposed.
Some researchers have used repeated K-means to obtain clustering labels in LDA and LDA to select the discriminant subspace in K-means clustering
| [5] | la, Torre, F, D., Kanade, T. Discriminative cluster analysis. Int, Conf, on Machine Learning (ICML). 2006, 241–248. |
| [6] | Ding, C., Li, T. Adaptive dimension reduction using discriminant analysis and k-means clustering. Int, Conf, on Machine Learning (ICML). 2007, 521–528. |
[5, 6]
.
In
| [7] | Ye, J., Zhao, Z., Wu, M. Discriminative k-means for clustering. Neural Information Processing System (NIPS). 2008, 1649–1656. |
[7]
, a discriminant K-means (DisKmeans) algorithm is proposed to solve the trace maximization problem by a simple iterative procedure.
However, LDA cannot be directly used on high-dimensional image datasets because of the small-sample-size (SSS) problem.
Therefore, in
| [8] | Fukunaga, K. Feature extraction and linear mapping for classification., in, Introduction to statistical pattern recognition. Ed, Rheinboldt, W. (Academic., San, Diego., CA. 1990, 2nd, edn). |
[8]
, discriminant information in the data matrix was used for linear discriminant analysis.
Suppose that X is an image dataset consisting of n images from c different classes.
Let us denote the within-class and between-class scattering matrices by Sw and Sb, respectively.
We can obtain the optimal scaled cluster assignment matrix
A* using LDA by solving the maximization problem
| [8] | Fukunaga, K. Feature extraction and linear mapping for classification., in, Introduction to statistical pattern recognition. Ed, Rheinboldt, W. (Academic., San, Diego., CA. 1990, 2nd, edn). |
[8]
as follows
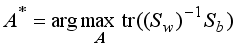
.
(1) In
| [9] | Liu, K., et al. A generalized optimal set of discriminant vectors. Pattern Recognit. 1992, 25, 731–739. |
[9]
, LDA was modified by using the total scattering matrix
St(=
Sw+
Sb) instead of
Sw in (
1).
In image clustering by LDA, if the number of images in an image dataset is less than the image feature dimension then the SSS problem often occurs.
Methods to deal with the SSS problem in LDA at the global level have been proposed in
| [10] | Friedman, J, H. Regularized discriminant analysis. J, Am, Stat, Assoc. 1989, 84(405), 165–175. |
| [11] | Tebbens, J, D., Schlesinger, P. Improving implementation of linear discriminant analysis for the high dimension/small sample size problem. Comput, Stat, Data, Anal. 2007, 52, 423–437. |
| [12] | Howland, P., Wang, J., Park, H. Solving the small sample size problem in face recognition using generalized discriminant analysis. Pattern Recognit. 2006, 39, 277–287. |
[10-12]
.
The regularized discriminant analysis (RDA) is presented in
| [10] | Friedman, J, H. Regularized discriminant analysis. J, Am, Stat, Assoc. 1989, 84(405), 165–175. |
[10]
, where they added the identity matrix
I with regularization parameter
<i></i>>0 to make
St non-singular such as the following
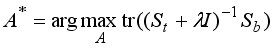
.
(2) In RDA,
St and
Sb are evaluated on a global level for the entire image dataset X. In
| [13] | Wu, M., Scholkopf, B. A local learning approach for clustering. Neural Information Processing System (NIPS). 2006, 1529–1536. |
| [14] | Saul, L, K., Roweis, S, T. Think globally fit locally: unsupervised learning of low dimensional manifolds. J, Mach, Learn, Res. 2003, 4, 119–155. |
| [15] | Sugiyama, M. Dimensionality reduction of multimodal labeled data by local Fisher discriminant analysis. J, Mach, Learn, Res. 2007, 8, 1027–1061. |
| [16] | Shi, J., Malik, J. Normalized cuts and image segmentation. IEEE Trans, Pattern Anal, Mach, Intell. 2000, 22(8), 888–905. |
| [17] | Yang, Y., Xu, D., Nie, F., Yan, S., Zhuang, Y. Image clustering using local discriminant models and global integration. IEEE Trans, Image Process. 2010, 19(10), 2761–2773. |
| [18] | Nie, F., Zeng, Z., Tsang, I, W., Xu, D., Zhang, C. Spectral embedded clustering: a framework for in-sample and out-of-sample spectral clustering. IEEE Trans, Neural Netw. 2011, 22(11), 1796–1808. |
[13-18]
using the manifold assumption, researchers have developed various local learning based clustering methods to efficiently learn nonlinear manifolds in image data using local neighborhood information.
Ncut (normalized cutting)
| [16] | Shi, J., Malik, J. Normalized cuts and image segmentation. IEEE Trans, Pattern Anal, Mach, Intell. 2000, 22(8), 888–905. |
[16]
and K-way Ncut
| [19] | Yu, S, X., Shi, J. Multiclass spectral clustering. International Conference on Computer Vision (ICCV), 2003, 313–339. |
[19]
are well-known clustering methods that perform data clustering through local learning based on similarity between neighboring data points.
In
| [17] | Yang, Y., Xu, D., Nie, F., Yan, S., Zhuang, Y. Image clustering using local discriminant models and global integration. IEEE Trans, Image Process. 2010, 19(10), 2761–2773. |
[17]
, based on RDA
| [10] | Friedman, J, H. Regularized discriminant analysis. J, Am, Stat, Assoc. 1989, 84(405), 165–175. |
[10]
, an image clustering model using LDMGI (local discriminant models and global integration) is proposed.
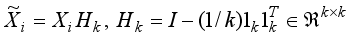
In LDMGI, the local image matrix Xi is made using k-nearest neighbor images of each image xi in the image dataset X.
To evaluate the clustering performance of images in the local image matrix Xi, a local clustering model was considered.
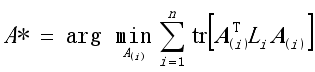
The local clustering model with all the local image matrices Xi, i1, 2,…, n, is set as the following optimization problem.
,
(3) 
,
(4) where
A(i),

,

are the local scaled cluster assignment matrix, local discriminant model and centering matrix for the local image matrix
Xi, respectively. And

is expressed by
.
To obtain the solution of the cluster assignment matrix, we used the eigenvalue decomposition method, which obtains a more discretized binary cluster assignment matrix for each image data xi, i1, 2, …, n of the image dataset X.
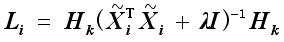
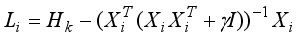
Next, comparing (
2) and (
4), we can see that the regularization parameter
<i></i> added in (
2) to solve the SSS problem of LDA on the image dataset
X at the global level also exists in the local discriminant model
Li, such as (
4), to deal with the SSS problem of LDA on the local image data
Xi at the local level.
In the LDMGI model proposed in
| [17] | Yang, Y., Xu, D., Nie, F., Yan, S., Zhuang, Y. Image clustering using local discriminant models and global integration. IEEE Trans, Image Process. 2010, 19(10), 2761–2773. |
[17]
, the value of
<i></i> was chosen reasonably for {10
−8, 10
−6, 10
−4, 10
−2, 10
0, 10
2, 10
4, 10
6, 10
8} and the number of images
k nearest to image
xi was set to 5.
In
| [20] | Zhang, T., Fang, B., Tang, Y, Y., Shang, Z., Xu, B. Generalized discriminant analysis: a matrix exponential approach. IEEE Trans, Syst, Man Cybern, B. 2010, 40(1), 186-197. |
[20]
, an EDA (exponential discriminant analysis) is proposed to map scattering matrices into exponential domain in LDA.
As shown in
| [20] | Zhang, T., Fang, B., Tang, Y, Y., Shang, Z., Xu, B. Generalized discriminant analysis: a matrix exponential approach. IEEE Trans, Syst, Man Cybern, B. 2010, 40(1), 186-197. |
[20]
, the discriminant information of LDA is not lost even in EDA.
Some researchers have proposed exponential local discriminant embedding (ELDE)
| [21] | Dornaika, F., Bosaghzadeh, A. Exponential local discriminant embedding and its application to face recognition. IEEE Trans, Cybern. 2013, 43(3), 921–934. |
[21]
and exponential discriminant analysis method
| [22] | Nasir, Ahmed. Image clustering using exponential discriminant analysis. IET Comput, Vis. 2015, Vol, 9, Iss, 1, 1–12. |
[22]
based on local learning for face recognition problems.
In this paper, we consider a regularized exponential discriminant model based on local learning.
In LERDC (local exponential regularized discriminant clustering) model, the local scattering matrices of regularized discriminant are mapped onto the exponential domain.
In the proposed LERDC model, the local image matrix Xi for each image xi was constructed including k (=5) nearest neighbor images and a local exponential regularized discriminant model (LERDM) was proposed to perform clustering for images in the local image matrix Xi.
The whole image clustering result was obtained by summing all the LERDMs for all local image matrices Xi, i = 1, 2,..., n.
In LERDM for image
xi,

is the image complement of

, and
k and
<i></i> are the clustering parameters in the proposed local exponential regularized discriminant clustering model.
The clustering performance of the proposed LERDC model is comparable to known clustering models (Ncut
| [19] | Yu, S, X., Shi, J. Multiclass spectral clustering. International Conference on Computer Vision (ICCV), 2003, 313–339. |
[19]
, SEC
| [18] | Nie, F., Zeng, Z., Tsang, I, W., Xu, D., Zhang, C. Spectral embedded clustering: a framework for in-sample and out-of-sample spectral clustering. IEEE Trans, Neural Netw. 2011, 22(11), 1796–1808. |
[18]
and LDMGI
| [17] | Yang, Y., Xu, D., Nie, F., Yan, S., Zhuang, Y. Image clustering using local discriminant models and global integration. IEEE Trans, Image Process. 2010, 19(10), 2761–2773. |
[17]
).
Experimental results using 10 image databases showed that the proposed LERDC model can compare clustering performance with the LDMGI model.
The proposed LERDC model is based on EDA.
The proposed LERDC model is evaluated to be able to compare clustering performance with the currently known local learning-based clustering methods.
The rest of this paper is organized as follows.
In Section 2 of the paper, we give the mathematical formulation of the LERDC model.
In Section 3, the proposed LERDC model is compared with the existing clustering method. The experimental results are presented in Section 4. The conclusions for the proposed LERDC are given in Section 5.
2. LERDC Model
In this section, we describe the proposed local exponential regularized discriminant clustering (LERDC) model for image clustering.
Let be a set of n images and X = {x1, x2, …, xn}Rm×n be the image data matrix, where xiRm, I = 1, 2,…, n is the ith image data and m is the feature dimension of image data xi.
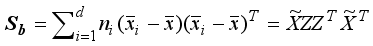
For image data matrix X, the total scattering matrix St and the between-class scattering matrix Sb are
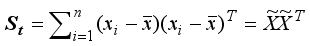
,
,
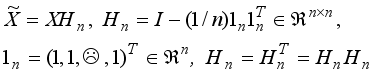
where

is the centralization matrix of the image data matrix
X,

is the average of images belonging to the
ith class, and

is the average of
n images belonging to the image dataset
. Image clustering is to partition
n images into
d clusters {
Dj,
j1, 2, …,
d} of similar images. Let
Y=[
y1,
y2, …,
yn]
T{0, 1}
n×d be the cluster assignment matrix, where
yi{0, 1}
d×1 is a cluster assignment column vector whose image
xi belongs to the
jth cluster, while the
jth element of
yi is 1 and otherwise 0.
By
| [19] | Yu, S, X., Shi, J. Multiclass spectral clustering. International Conference on Computer Vision (ICCV), 2003, 313–339. |
[19]
, the scaled cluster assignment matrix
Zn<sup></sup>d is given by
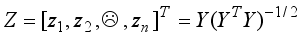
,
(5) where zi is the scaled cluster assignment vector as follows
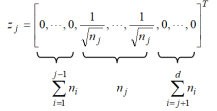
(6)
Here nj is the number of images in the jth cluster {Dj, j1, 2, …, d}.
In (
5), we see that
YTY is a diagonal matrix and
ZTZ=(YTY)<sup></sup>1/2YTY(YTY)<sup></sup>1/2=I(7)
From
| [6] | Ding, C., Li, T. Adaptive dimension reduction using discriminant analysis and k-means clustering. Int, Conf, on Machine Learning (ICML). 2007, 521–528. |
[6]
, the optimal scaled cluster assignment matrix
Z* can be write as
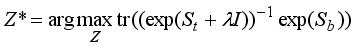
. (8)
Using (
7), the maximization problem of (
8) can be replaced by the minimization problem as follows
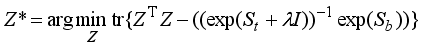
. (9)
The manifold learning algorithms
| [13] | Wu, M., Scholkopf, B. A local learning approach for clustering. Neural Information Processing System (NIPS). 2006, 1529–1536. |
| [14] | Saul, L, K., Roweis, S, T. Think globally fit locally: unsupervised learning of low dimensional manifolds. J, Mach, Learn, Res. 2003, 4, 119–155. |
[13, 14]
and clustering algorithms
| [16] | Shi, J., Malik, J. Normalized cuts and image segmentation. IEEE Trans, Pattern Anal, Mach, Intell. 2000, 22(8), 888–905. |
| [17] | Yang, Y., Xu, D., Nie, F., Yan, S., Zhuang, Y. Image clustering using local discriminant models and global integration. IEEE Trans, Image Process. 2010, 19(10), 2761–2773. |
| [18] | Nie, F., Zeng, Z., Tsang, I, W., Xu, D., Zhang, C. Spectral embedded clustering: a framework for in-sample and out-of-sample spectral clustering. IEEE Trans, Neural Netw. 2011, 22(11), 1796–1808. |
[16-18]
demonstrated that using local geometric properties is beneficial to recover the intrinsic manifold structure of data in manifold learning. Considering that the structure of the local manifold in
| [14] | Saul, L, K., Roweis, S, T. Think globally fit locally: unsupervised learning of low dimensional manifolds. J, Mach, Learn, Res. 2003, 4, 119–155. |
[14]
is mostly linear, it can be considered that the local image cluster
k(
Let the index set of images belonging to the set of local images
k(
xi) for image
xi be
Fi={
i0,
i1,
i2, ….,
ik−1},
i0=
i, and the local image data matrix of
k(
xi) be
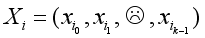
.
The total scattering matrix and the between-class scattering matrix for the local image data matrix Xi can be defined as follows
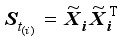
,
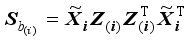
,
where Z(i) is the local scaled cluster assignment matrix obtained from matrix Z as follows
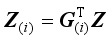
.
(10) In (10) elements of G(i){0, 1}n×k is the selection matrix with its elements (Gi)pq=1 if p=Fi{q}; (Gi)pq=0, otherwise and
The jth column of the matrix Z(i) is equal to
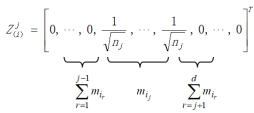 (11)
(11) where

,
r=1, 2, …,
d be the number of images belonging to the
rth cluster in the set of local images
k(
xi). As in
| [17] | Yang, Y., Xu, D., Nie, F., Yan, S., Zhuang, Y. Image clustering using local discriminant models and global integration. IEEE Trans, Image Process. 2010, 19(10), 2761–2773. |
[17]
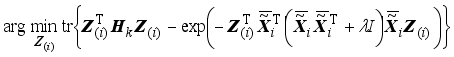
, imposing a regular term
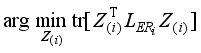
to control the power of LERDC, the objective function for the
ith local image matrix
Xi can be written as follows
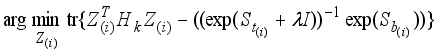
. (12)
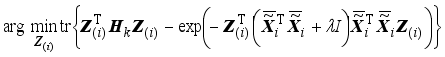
Using define and property of matrix exponential, we have
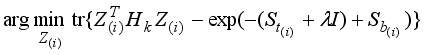
.
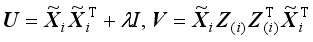
(13) Also, substituting values for

and

in (13), we obtain
. (14)
It has been shown in
| [23] | Higham, N, J. Functions of matrices: theory and computation. Society for Industrial and Applied Mathematics. Philadelphia, PA, USA, 2008. |
[23]
that for any square matrix
U, its exponential exp(
U) is finite and there is also an inverse
(exp(U))<sup></sup>1 = exp(U).
Using Jordan matrix decomposition in
| [24] | Williamson, R. Introduction to differential equations. Prentice-Hall, Englewood Cliffs, NJ. 1986. |
[24]
, the square matrix
U is decomposed into
U=WJW <sup></sup>1,
where U and J are similar matrices, J is a matrix of Jordan canonical form and W<sup></sup>1 is the matrix inverse of W. We can write from the above relation: J=W−1UW. Thus, we can see that
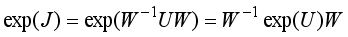
.
Lemma
| [22] | Nasir, Ahmed. Image clustering using exponential discriminant analysis. IET Comput, Vis. 2015, Vol, 9, Iss, 1, 1–12. |
[22]
: Let
and

are the image complements of matrices
U and
V, respectively. Then we have

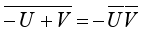
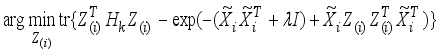
By the Lemma, (14) can be written as follows
, (15)
where

is the image complement of

obtained using
| [25] | MATLAB, version 7.10.0 (R2011a). The MathWorks Inc, Natick, MA. 2011. |
[25]
.
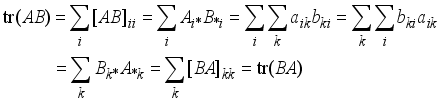
Theorem 1: Let matrix A is dn dimension and B is nd dimension. Then tr(AB)tr(BA)
Proof:
Let
A=
and
B=

from theorem 1. Then we show that (15) can be circularly shifted as follows
.(16)
, (17)
because A(ATA+<i></i>I)(AAT+<i></i>I)A for any matrix A.
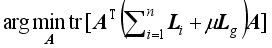
Theorem 2: The optimization problem of (
17) is equivalent to the following cost function
 (18)
(18) We can simply prove by using the proof method of theorem 6 in
| [22] | Nasir, Ahmed. Image clustering using exponential discriminant analysis. IET Comput, Vis. 2015, Vol, 9, Iss, 1, 1–12. |
[22]
.
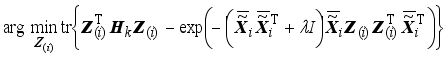
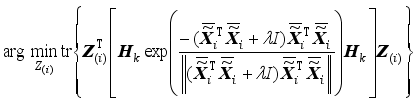
Using Theorem 2, we can write (18) as follows
,
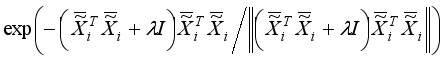
(19) where
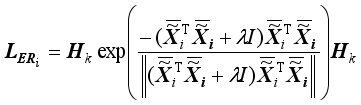 (20)
(20) is the LERDM (local exponential regularized discriminant model) for the image xi.
In (20), the dimensions of

and

are
d×k and
k×
k, respectively. Also, as in
| [17] | Yang, Y., Xu, D., Nie, F., Yan, S., Zhuang, Y. Image clustering using local discriminant models and global integration. IEEE Trans, Image Process. 2010, 19(10), 2761–2773. |
| [18] | Nie, F., Zeng, Z., Tsang, I, W., Xu, D., Zhang, C. Spectral embedded clustering: a framework for in-sample and out-of-sample spectral clustering. IEEE Trans, Neural Netw. 2011, 22(11), 1796–1808. |
[17, 18]
, the number of nearest neighbor images
k is set to 5. Thus,

,
i1, 2, …,
n is the
k×
k matrix which is computationally not extensive.
To obtain the optimal
Z, the following objective function was obtained by summing all the local exponential regularized discriminant model (LERDM)

,
i1, 2, …,
n:
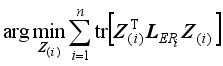
.
(21) From (10), we have
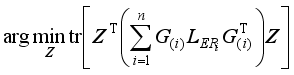
.
Let
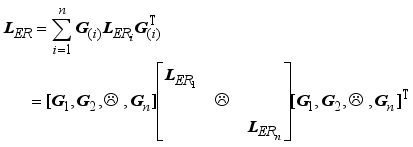 (22)
(22) The objective function of LERDC becomes
(23)
As proved in
| [17] | Yang, Y., Xu, D., Nie, F., Yan, S., Zhuang, Y. Image clustering using local discriminant models and global integration. IEEE Trans, Image Process. 2010, 19(10), 2761–2773. |
[17]
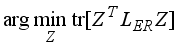
, the matrix defined in (22) is a Laplacian operator matrix. However, the objective function for the local exponentially regularized discriminant clustering using regularized discriminant with two constraints
Z=
Y(
YTY)
−1/2 and
ZTZ=
I for
Z can be written as
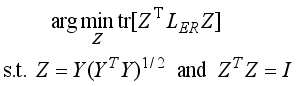 (24)
(24) Since the scaling cluster assignment matrix Z of the objective function in (24) is constrained by
Z=
Y(
YTY)
−1/2, removing this constraint from
| [26] | Duda, R., Hart, P., Stroke, D. Pattern classification. Wiley. 2007, 2nd, edn. |
[26]
and relaxing Z in the continuous range, the objective function can be written as
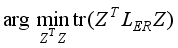
.
To solve such optimization problems, eigenvalue decomposition method is used.
where <i></i>0<<i></i>1<<i></i>2<, …., <<i></i>n−1 are the eigenvalues and ωi, i0, 1, …, n1 are the corresponding eigenvectors. Eliminating the trivial solutions with <i></i>0=0 and ω0=1n, we have the optimal scaled cluster allocation matrix Z* as follows
We define the mapping to cluster allocation matrix Y* from the scaled cluster assignment matrix Z* as
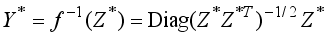 (27)
(27) Then, by solving the following optimization problem
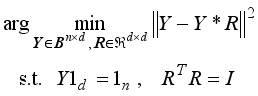 (28)
(28) using spectral rotation
| [19] | Yu, S, X., Shi, J. Multiclass spectral clustering. International Conference on Computer Vision (ICCV), 2003, 313–339. |
[19]
, we obtain the cluster allocation matrix
Y∈
Bn×d and the rotation matrix
R simultaneously. We summarize our proposed LERDC model in Algorithm 1.
Algorithm 1
Procedure Y=LERDC(X)
1) For each image xi, we construct a set of local images k(xi), k=5, i=1, …, n and obtain the image data matrix Xi.
2) Using
| [25] | MATLAB, version 7.10.0 (R2011a). The MathWorks Inc, Natick, MA. 2011. |
[25]
, we obtain the image complement

of

, where
;
3) Compute

,
i1, 2, …,
n according to (20);
4) Compute LER using (22);
5) To obtain the optimal Z*=[ω1, ω2, …, ωd<sub></sub>1, ωd], we solve the eigenvalue decomposition problem in (25). The solution ω0=1n corresponding to the eigenvalue <i></i>0=0 is eliminated;
6) Compute
Y* by (27) and solve the optimization problem (28) using spectral rotation
| [19] | Yu, S, X., Shi, J. Multiclass spectral clustering. International Conference on Computer Vision (ICCV), 2003, 313–339. |
[19]
.
3. Comparison with Previous Clustering Models
To compare the optimization problem for the LERDC model presented in this paper, we briefly describe the optimization problem for the local learning-based clustering models proposed in the previous Ncut
| [19] | Yu, S, X., Shi, J. Multiclass spectral clustering. International Conference on Computer Vision (ICCV), 2003, 313–339. |
[19]
, SEC
| [18] | Nie, F., Zeng, Z., Tsang, I, W., Xu, D., Zhang, C. Spectral embedded clustering: a framework for in-sample and out-of-sample spectral clustering. IEEE Trans, Neural Netw. 2011, 22(11), 1796–1808. |
[18]
, and LDMGI
| [17] | Yang, Y., Xu, D., Nie, F., Yan, S., Zhuang, Y. Image clustering using local discriminant models and global integration. IEEE Trans, Image Process. 2010, 19(10), 2761–2773. |
[17]
.
3.1. Normalized Cut
In NCut
| [16] | Shi, J., Malik, J. Normalized cuts and image segmentation. IEEE Trans, Pattern Anal, Mach, Intell. 2000, 22(8), 888–905. |
[16]
,
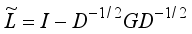 (29)
(29) is a Laplace matrix, where
D is a diagonal matrix with the diagonal elements
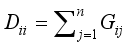
for
i=1,…,
n and
G is a graph affinity matrix computed with the Gaussian function
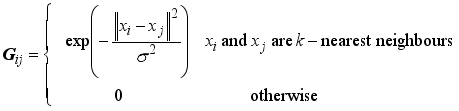
.
The k- nearest neighbors and the bandwidth σ are the clustering parameters.
3.2. SEC (Spectral Embedded Clustering)
In
| [18] | Nie, F., Zeng, Z., Tsang, I, W., Xu, D., Zhang, C. Spectral embedded clustering: a framework for in-sample and out-of-sample spectral clustering. IEEE Trans, Neural Netw. 2011, 22(11), 1796–1808. |
[18]
, the SEC model becomes the following optimization problem.
where
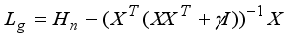 (30)
(30) and
. (31)
The k-nearest neighbors and the regularization parameters μ and γ are the clustering parameters.
Table 1. Clustering parameters in clustering models.
Clustering Models | Clustering parameters | Total clustering parameters |
NCut 19] | k, σ | 2 |
SEC 18] | k, γ, μ | 3 |
LDMGI 7] | k, λ | 2 |
proposed LERDC | k, λ | 2 |
3.3. LDMGI (Local Discriminant Model and Global Integration)
The LDMGI clustering model proposed in
| [17] | Yang, Y., Xu, D., Nie, F., Yan, S., Zhuang, Y. Image clustering using local discriminant models and global integration. IEEE Trans, Image Process. 2010, 19(10), 2761–2773. |
[17]
is the following optimization problem
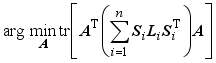
,
where
Si is the selection matrix such as (10) and
Li is the same as (
4). The clustering parameters are
k-nearest neighbors and the regularization parameter
<i></i>.
As shown in
Table 1, compared with previous clustering methods
| [17] | Yang, Y., Xu, D., Nie, F., Yan, S., Zhuang, Y. Image clustering using local discriminant models and global integration. IEEE Trans, Image Process. 2010, 19(10), 2761–2773. |
| [18] | Nie, F., Zeng, Z., Tsang, I, W., Xu, D., Zhang, C. Spectral embedded clustering: a framework for in-sample and out-of-sample spectral clustering. IEEE Trans, Neural Netw. 2011, 22(11), 1796–1808. |
| [19] | Yu, S, X., Shi, J. Multiclass spectral clustering. International Conference on Computer Vision (ICCV), 2003, 313–339. |
[17-19]
, we also find that the number of nearest neighbor images
k is a clustering parameter in the proposed LERDC model.
In this study, we show in (
2) that the clustering parameter
involved to deal with the SSS problem of LDA is a restriction. Also, when we carefully compare (30) and (31) with (
4), we see that the objective of the regularization parameter
γ is equal to
<i></i>.
In the SEC model, parameter γ was included because of the singularity problem in the scattering matrices for high-dimensional image datasets.
4. Experiment
We compare the performance of the proposed LERDC model with K-means, NCut
| [19] | Yu, S, X., Shi, J. Multiclass spectral clustering. International Conference on Computer Vision (ICCV), 2003, 313–339. |
[19]
, SEC
| [18] | Nie, F., Zeng, Z., Tsang, I, W., Xu, D., Zhang, C. Spectral embedded clustering: a framework for in-sample and out-of-sample spectral clustering. IEEE Trans, Neural Netw. 2011, 22(11), 1796–1808. |
[18]
, and LDMGI
| [17] | Yang, Y., Xu, D., Nie, F., Yan, S., Zhuang, Y. Image clustering using local discriminant models and global integration. IEEE Trans, Image Process. 2010, 19(10), 2761–2773. |
[17]
clustering models using twelve benchmark image datasets.
A comparative study about the performances of all clustering models is performed by clustering accuracy (ACC) and normalized mutual information (NMI) performance measures.
The initialization
| [19] | Yu, S, X., Shi, J. Multiclass spectral clustering. International Conference on Computer Vision (ICCV), 2003, 313–339. |
[19]
is affected to the results for all clustering algorithms.
In order to reduce statistical variation, the random initialization was repeated 20 times during the simulation.
The average of the results of repeated runs for each clustering model is estimated by ACC ± std and NMI ± std, where std is the standard deviation from the mean.
The clustering performance is the best when ACC and NMI are the best in 20 runs.
4.1. Image Dataset
To evaluate the performance of the new image clustering model, we used 10 870 samples from 10 benchmark image datasets.
We used 20 objects from the Caltech101 image database
containing an image of objects belonging to 101 classes with 40 ~ 800 images per class.
The Caltech faces dataset
| [28] | Weber, M. Frontal face dataset. Computational Vision Group, California Institute of Technology. 2012. Available at,
http://www. vision.caltech.edu/html-files/archive.html |
[28]
involves 450 face images for 27 people under different lighting, expressions and backgrounds, where 380 face images for 19 people were used.
The COIL-20 database has 1 200 images for 20 objects, each consisting of 60 images captured from different views
| [29] | Nene, S, A., Nayar, S, K., Murase, H. Columbia Object Image Library (Coil-20). 1996. |
[29]
.
Corel database
divided the images from
| [30] | Xu, D., Yan, S., Tao, D., Lin, S., Zhang, H., Huang, T. Reconstruction and recognition of tensor-based objects with concurrent subspaces analysis. IEEE Trans, Circuits Syst, Video Technol. 2008, 18(1), 36–47. |
[30]
into 80 concept groups, where 20 concept groups were used, such as aircraft, car, doll, flag, boat, steam engine and train, according to the category of objects.
The JAFFE database used 150 images of different facial expressions of 10 female models
| [32] | Lyons, M, J., Budynek, J., Akamatsu, S. Automatic classification of single facial images. IEEE Trans, Pattern Anal, Mach, Intell. 1999, 21(12), 1357–1362. |
[32]
.
The MPEG7 shape image database
| [33] | Bicegoa, M., Murinoa, V., Figueiredob, M, A. Similarity-based classification of sequences using hidden Markov models. Pattern Recognit. 2004, 37(12), 2281–2291. |
| [34] | Thakoor, N., Gao, J., Jung, S. Hidden Markov model-based weighted likelihood discriminant for 2-d shape classification. IEEE Trans, Image Process. 2007, 16(11), 2707–2719. |
[33, 34]
used 540 images aligned by geometric transformation using
| [25] | MATLAB, version 7.10.0 (R2011a). The MathWorks Inc, Natick, MA. 2011. |
[25]
.
The ORL image database
| [35] | Samaria, F., Harter, A. Parameterisation of a stochastic model for human face identification. Proc, 2nd IEEE Workshop on Applications of Computer Vision. 1994, 138–142. |
[35]
contains 400 images of different time, facial expression and face detail for 40 distinct subjects.
The Pointing 04 face database contains images of 15 people covering a wide range of poses with various skin colors, with or without glasses
| [36] | Gourier, N., Hall, D., Crowley, J, L. Estimating face orientation from robust detection of salient facial features. Int, Workshop on Visual Observation of Deictic Gestures (ICPR). 2004, 17–25. |
[36]
.
The Scenes image database includes forest, mountain and city centers, which are composed of eight different categories for both urban and natural
| [37] | Oliva, A., Torralba, A. Modeling the shape of the scene: a holistic representation of the spatial envelope. Int, J, Comput, Vis. 2001. 42(3), 145–175. |
[37]
.
The Yalefaces database contains 150 images of 15 subjects with different facial expressions and illumination conditions and there are 10 images per subject
| [38] | Belhumeur, P, N., Hespanha, J, P., Kriegman, D, J. Eigenfaces vs. fisherfaces: recognition using class specific linear projection. IEEE Trans, Pattern Anal, Mach, Intell. 1997, 19(7), 711–720. |
[38]
.
In
Table 2, detailed descriptions of sample size, the number of classes, original image size and feature dimension for each image dataset are given.
Table 2. Description of image datasets and image feature dimension.
Dataset | Sample size | Image size | Feature dimension | Class number |
Caltech101 | 1 000 | 260300 | 1 200 | 20 |
Caltech faces | 380 | 896592 | 2 072 | 19 |
COIL20 | 1 200 | 256256 | 1 024 | 20 |
COREL | 2 400 | 12080 | 1 600 | 20 |
JAFFE | 150 | 256256 | 676 | 10 |
MPEG7 | 540 | 300250 | 200 | 30 |
ORL | 400 | 11292 | 644 | 40 |
Pointing04 | 2 250 | 384288 | 1 120 | 15 |
Scenes | 2 400 | 256256 | 676 | 8 |
Yelefaces | 150 | 320243 | 1 024 | 15 |
4.2. Performance Evaluation of LERDC
In this paper, we used clustering accuracy (ACC) and NMI to evaluate the performance of the classification method.
4.2.1. Clustering Accuracy (ACC)
For the ith image, let qi be the result of clustering by clustering algorithm and pi be the ground truth label. The ACC is defined as follows
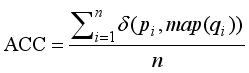 (32)
(32) where n is the total number of images, map(qi) is the optimal mapping function that permutes clustering labels to match the ground truth labels, and δ (p, q) =1 if p = q.
Using the Kuhn-Munkres algorithm
| [39] | Papadimitriou, C, H., Steiglitz, K. Combinatorial optimization: algorithms and complexity. Dover, New York. 1998. |
[39]
, we obtain the optimal mapping. The larger ACC indicates better clustering performance.
However, when the number of classes in the image dataset is large, it is tedious to compute the ACC using the Kuhn-Munkres algorithm
| [39] | Papadimitriou, C, H., Steiglitz, K. Combinatorial optimization: algorithms and complexity. Dover, New York. 1998. |
[39]
.
Zhu et al. improved the Kuhn-Munkres algorithm by choosing a reasonable size of permutation in class labels to maximize ACC
| [40] | Zhu, H., Zhou, M., Alkins, R. Group role assignment via a Kuhn-Munkres algorithm-based solution. IEEE Trans, Syst, Man Cybern, A. 2012, 42(3), 739–750. |
[40]
.
4.2.2. Normalized Mutual Information (NMI)
Another widely used measure to evaluate clustering results is NMI. For two arbitrary variables S and T, NMI is defined as follows
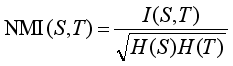 (33)
(33) where I(S, T) represents the mutual information between S and T.
H(S) and H(T) are the entropies of S and T, respectively. It is obvious that NMI (S, T) is 1 if S is identical to T, and 0 if S is not similar to T.
Let th be the total samples in the hth ground truth class (1≤h≤d) and tm be the number of samples in cluster Dm(1≤m≤d) obtained by using the clustering algorithms.
NMI is defined as
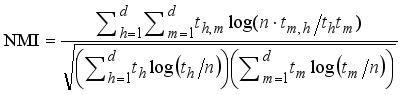 (34)
(34) where th,m is the number of samples belonging to both the hth ground truth class and the cluster Dm. When the NMI is large, the clustering results are good.
4.3. Discussion About Clustering Parameters
For comparison with all clustering models, we have
k = 5 as in
| [17] | Yang, Y., Xu, D., Nie, F., Yan, S., Zhuang, Y. Image clustering using local discriminant models and global integration. IEEE Trans, Image Process. 2010, 19(10), 2761–2773. |
| [18] | Nie, F., Zeng, Z., Tsang, I, W., Xu, D., Zhang, C. Spectral embedded clustering: a framework for in-sample and out-of-sample spectral clustering. IEEE Trans, Neural Netw. 2011, 22(11), 1796–1808. |
[17, 18]
.
The optimal value of
σ and
<i></i> were determined from the set {10
−8, 10
−6, 10
−4, 10
−2, 10
0, 10
2, 10
4, 10
6, 10
8} as in
| [17] | Yang, Y., Xu, D., Nie, F., Yan, S., Zhuang, Y. Image clustering using local discriminant models and global integration. IEEE Trans, Image Process. 2010, 19(10), 2761–2773. |
[17]
. Also, with
μ= 1, the optimal value of
γ was determined from the set {10
−8, 10
−6, 10
−4, 10
−2, 10
0, 10
2, 10
4, 10
6, 10
8}.
In the clustering models based on local learning, the parameter
k affects the clustering performance
| [17] | Yang, Y., Xu, D., Nie, F., Yan, S., Zhuang, Y. Image clustering using local discriminant models and global integration. IEEE Trans, Image Process. 2010, 19(10), 2761–2773. |
[17]
.
For most image data sets, we observed that the optimal value of parameter k in the proposed LERDC model from the set { 2, 3, 4, 5, 6, 7, 8, 10 } is 5.
In
| [41] | Wang, F., Zhang, C. Clustering with local and global regularization. IEEE Trans, Knowl, Data Eng. 2009, 21(12), 1665–1678. |
[41]
, the neighborhood size
k was defined from the set {5, 10, 20, 50, 100}.
Table 3. Performance comparison of proposed LERDC with previous clustering models (best ACC and mean ACC±std).
Dataset | best ACC | mean ACC±std |
K-meas | NCut | [19] | Yu, S, X., Shi, J. Multiclass spectral clustering. International Conference on Computer Vision (ICCV), 2003, 313–339. |
[19] | SEC | [18] | Nie, F., Zeng, Z., Tsang, I, W., Xu, D., Zhang, C. Spectral embedded clustering: a framework for in-sample and out-of-sample spectral clustering. IEEE Trans, Neural Netw. 2011, 22(11), 1796–1808. |
[18] | LDMGI | [17] | Yang, Y., Xu, D., Nie, F., Yan, S., Zhuang, Y. Image clustering using local discriminant models and global integration. IEEE Trans, Image Process. 2010, 19(10), 2761–2773. |
[17] | LERDC | K-means | NCut | [19] | Yu, S, X., Shi, J. Multiclass spectral clustering. International Conference on Computer Vision (ICCV), 2003, 313–339. |
[19] | SEC | [18] | Nie, F., Zeng, Z., Tsang, I, W., Xu, D., Zhang, C. Spectral embedded clustering: a framework for in-sample and out-of-sample spectral clustering. IEEE Trans, Neural Netw. 2011, 22(11), 1796–1808. |
[18] | LDMGI | [17] | Yang, Y., Xu, D., Nie, F., Yan, S., Zhuang, Y. Image clustering using local discriminant models and global integration. IEEE Trans, Image Process. 2010, 19(10), 2761–2773. |
[17] | LERDC |
JAFFE | 83.2 | 95.8 | 96.0 | 96.8 | 97.5 | 75.8±6.2 | 94.8±0.8 | 95.0±0.6 | 95.8±0.6 | 96.8±0.4 |
COIL-20 | 66.9 | 83.1 | 81.2 | 84.3 | 86.4 | 62.0±3.5 | 82.2±0.7 | 78.8±1.2 | 83.5±0.4 | 85.4±0.5 |
ORL | 73.3 | 78.6 | 82.9 | 82.3 | 83.4 | 67.1±4.0 | 77.5±1.0 | 82.0±0.6 | 81.6±0.3 | 82.7±0.3 |
Pointing04 | 52.8 | 64.7 | 65.0 | 67.0 | 69.2 | 49.3±3.2 | 63.8±0.4 | 63.2±0.8 | 65.3±1.2 | 68.3±0.7 |
Yalefaces | 60.7 | 70.5 | 73.7 | 66.7 | 68.4 | 56.4±4.0 | 69.7±0.5 | 73.2±0.3 | 65.5±0.8 | 67.2±0.4 |
MPEG7 | 72.0 | 68.7 | 73.6 | 67.9 | 70.6 | 66.7±3.4 | 67.2±1.0 | 72.8±0.5 | 65.8±1.5 | 69.8±0.5 |
COREL | 37.4 | 36.0 | 35.3 | 38.6 | 38.3 | 34.8±2.1 | 34.8±0.7 | 34.6±0.4 | 37.4±1.0 | 37.8±0.3 |
Caltech faces | 26.8 | 28.0 | 26.9 | 27.9 | 28.8 | 25.0±1.2 | 26.8±0.5 | 26.4±0.3 | 27.2±0.3 | 28.0±0.4 |
Scenes | 25.7 | 24.9 | 27.2 | 27.1 | 26.3 | 23.8±2.4 | 24.2±0.4 | 25.9±0.4 | 26.5±0.3 | 25.8±0.4 |
Caltech101 | 18.3 | 17.5 | 18.3 | 19.2 | 19.5 | 16.9±1.3 | 16.5±0.7 | 17.8±0.2 | 18.6±0.5 | 19.0±0.3 |
Overall mean | 51.7 | 56.8 | 58.0 | 57.8 | 58.8 | 47.8±3.1 | 55.8±0.6 | 57.0±0.5 | 56.7±0.7 | 58.1±0.4 |
Table 4. Performance comparison of proposed LERDC with previous clustering models (best NMI and mean NMI ± std).
Dataset | best NMI | mean NMI±std |
K-meas | NCut | [19] | Yu, S, X., Shi, J. Multiclass spectral clustering. International Conference on Computer Vision (ICCV), 2003, 313–339. |
[19] | SEC | [18] | Nie, F., Zeng, Z., Tsang, I, W., Xu, D., Zhang, C. Spectral embedded clustering: a framework for in-sample and out-of-sample spectral clustering. IEEE Trans, Neural Netw. 2011, 22(11), 1796–1808. |
[18] | LDMGI | [17] | Yang, Y., Xu, D., Nie, F., Yan, S., Zhuang, Y. Image clustering using local discriminant models and global integration. IEEE Trans, Image Process. 2010, 19(10), 2761–2773. |
[17] | LERDC | K-means | NCut | [19] | Yu, S, X., Shi, J. Multiclass spectral clustering. International Conference on Computer Vision (ICCV), 2003, 313–339. |
[19] | SEC | [18] | Nie, F., Zeng, Z., Tsang, I, W., Xu, D., Zhang, C. Spectral embedded clustering: a framework for in-sample and out-of-sample spectral clustering. IEEE Trans, Neural Netw. 2011, 22(11), 1796–1808. |
[18] | LDMGI | [17] | Yang, Y., Xu, D., Nie, F., Yan, S., Zhuang, Y. Image clustering using local discriminant models and global integration. IEEE Trans, Image Process. 2010, 19(10), 2761–2773. |
[17] | LERDC |
JAFFE | 90.8 | 95.4 | 95.7 | 96.5 | 97.8 | 85.3±2.7 | 94.3±0.5 | 94.9±0.3 | 95.6±0.8 | 96.7±0.6 |
COIL-20 | 80.2 | 90.3 | 87.6 | 95.2 | 95.8 | 76.8±1.5 | 89.2±0.8 | 87.0±0.4 | 94.8±0.2 | 95.3±0.2 |
ORL | 87.3 | 89.6 | 93.1 | 93.7 | 94.3 | 84.5±0.9 | 87.7±0.5 | 92.5±0.3 | 92.8±0.4 | 93.5±0.3 |
Pointing04 | 53.5 | 78.3 | 74.5 | 80.4 | 81.2 | 51.8±1.5 | 77.5±0.4 | 73.5±0.3 | 78.7±0.6 | 79.8±0.5 |
Yalefaces | 67.2 | 72.7 | 73.4 | 72.8 | 72.7 | 65.2±1.8 | 71.3±0.7 | 72.8±0.3 | 71.8±0.8 | 71.5±0.3 |
MPEG7 | 86.1 | 86.7 | 87.8 | 86.5 | 87.6 | 83.7±1.3 | 85.8±0.5 | 86.3±0.7 | 85.3±0.5 | 86.5±0.5 |
COREL | 41.2 | 39.8 | 39.4 | 41.8 | 42.5 | 39.7±0.6 | 38.6±0.5 | 38.4±0.5 | 40.4±0.8 | 41.3±0.6 |
Caltech faces | 31.7 | 35.6 | 36.8 | 35.1 | 36.4 | 30.3±1.2 | 34.3±1.0 | 35.5±0.8 | 34.5±0.4 | 35.2±0.7 |
Scenes | 8.9 | 10.6 | 11.2 | 13.6 | 13.2 | 8.5±0.2 | 10.1±0.3 | 10.5±0.5 | 12.9±0.3 | 12.4±0.6 |
Caltech101 | 21.3 | 19.8 | 20.3 | 20.1 | 20.4 | 18.5±1.0 | 18.9±0.6 | 19.1±0.6 | 19.7±0.2 | 19.5±0.4 |
Overall mean | 56.8 | 61.9 | 62.0 | 63.6 | 64.2 | 54.4±1.3 | 60.8±0.5 | 61.1±0.4 | 62.6±0.5 | 63.2±0.4 |
4.4. Performance Comparison
Tables 3 and 4 shows the image clustering performances of K-means, Ncut
| [19] | Yu, S, X., Shi, J. Multiclass spectral clustering. International Conference on Computer Vision (ICCV), 2003, 313–339. |
[19]
, SEC
| [18] | Nie, F., Zeng, Z., Tsang, I, W., Xu, D., Zhang, C. Spectral embedded clustering: a framework for in-sample and out-of-sample spectral clustering. IEEE Trans, Neural Netw. 2011, 22(11), 1796–1808. |
[18]
, LDMGI
| [17] | Yang, Y., Xu, D., Nie, F., Yan, S., Zhuang, Y. Image clustering using local discriminant models and global integration. IEEE Trans, Image Process. 2010, 19(10), 2761–2773. |
[17]
and proposed LERDC models.
The LERDC model achieved a comparable clustering performance as that of the near competitors Ncut
| [19] | Yu, S, X., Shi, J. Multiclass spectral clustering. International Conference on Computer Vision (ICCV), 2003, 313–339. |
[19]
, SEC
| [18] | Nie, F., Zeng, Z., Tsang, I, W., Xu, D., Zhang, C. Spectral embedded clustering: a framework for in-sample and out-of-sample spectral clustering. IEEE Trans, Neural Netw. 2011, 22(11), 1796–1808. |
[18]
and LDMGI
| [17] | Yang, Y., Xu, D., Nie, F., Yan, S., Zhuang, Y. Image clustering using local discriminant models and global integration. IEEE Trans, Image Process. 2010, 19(10), 2761–2773. |
[17]
by means of ACC and Ncut
| [19] | Yu, S, X., Shi, J. Multiclass spectral clustering. International Conference on Computer Vision (ICCV), 2003, 313–339. |
[19]
, LDMGI
| [18] | Nie, F., Zeng, Z., Tsang, I, W., Xu, D., Zhang, C. Spectral embedded clustering: a framework for in-sample and out-of-sample spectral clustering. IEEE Trans, Neural Netw. 2011, 22(11), 1796–1808. |
[18]
in terms of NMI.
Overall performance of Ncut
| [19] | Yu, S, X., Shi, J. Multiclass spectral clustering. International Conference on Computer Vision (ICCV), 2003, 313–339. |
[19]
, SEC
| [18] | Nie, F., Zeng, Z., Tsang, I, W., Xu, D., Zhang, C. Spectral embedded clustering: a framework for in-sample and out-of-sample spectral clustering. IEEE Trans, Neural Netw. 2011, 22(11), 1796–1808. |
[18]
, LDMGI
| [17] | Yang, Y., Xu, D., Nie, F., Yan, S., Zhuang, Y. Image clustering using local discriminant models and global integration. IEEE Trans, Image Process. 2010, 19(10), 2761–2773. |
[17]
and proposed LERDC is 55.8%, 57%, 56.7% and 58.1% in terms of mean ACC, 60.8%, 61.1%, 62.6% and 63.2% by mean NMI.
The overall cluster performance of the proposed LERDC model is comparable to that of the previous LDMGI model.
However, on image datasets such as Scenes, Caltech101, and Caltech faces, it is shown that the performance of all clustering models is not optimal.
In this study, all clustering models used image features based on pixel intensity values.
The image features were obtained using linear interpolation to adjust the size of the original images as shown in
| [17] | Yang, Y., Xu, D., Nie, F., Yan, S., Zhuang, Y. Image clustering using local discriminant models and global integration. IEEE Trans, Image Process. 2010, 19(10), 2761–2773. |
[17]
.
To improve the clustering performance on these challenging image datasets, we used an optimization image descriptor
| [42] | Ahmed, N., Jalil, A. Multimode image clustering using optimal image descriptor. IEICE Trans, Inf, Syst. 2014, E97-D (4), 743–751. |
[42]
.
The clustering result for Pointing 04 in our work is different from that reported in
| [17] | Yang, Y., Xu, D., Nie, F., Yan, S., Zhuang, Y. Image clustering using local discriminant models and global integration. IEEE Trans, Image Process. 2010, 19(10), 2761–2773. |
[17]
because the 1120-dimensional feature vector is not normalized.
We also used
| [25] | MATLAB, version 7.10.0 (R2011a). The MathWorks Inc, Natick, MA. 2011. |
[25]
to align images in the MPEG7 shape image database by geometric transformation from control pair points.
In the proposed LERDC model, we also studied the effect of rescaling after normalization of the exponential regularized matrix.
We rescaled the matrix obtained from
in (20) by multiplying it with Frobenius norm of
.
The experimental results show that after normalization, the effect of rescaling is not significant, and comparable clustering results were observed without rescaling the exponential regularized matrix after normalization.
We now discuss how and when the proposed LERDC model performs better as compared with the near competitor LDMGI clustering model
| [17] | Yang, Y., Xu, D., Nie, F., Yan, S., Zhuang, Y. Image clustering using local discriminant models and global integration. IEEE Trans, Image Process. 2010, 19(10), 2761–2773. |
[17]
.
Theoretically, these two clustering models utilized the discriminant performance of LDA at local level.
The LDMGI is based on RDA
| [10] | Friedman, J, H. Regularized discriminant analysis. J, Am, Stat, Assoc. 1989, 84(405), 165–175. |
[10]
whereas the proposed LERDC is based on EDA
| [20] | Zhang, T., Fang, B., Tang, Y, Y., Shang, Z., Xu, B. Generalized discriminant analysis: a matrix exponential approach. IEEE Trans, Syst, Man Cybern, B. 2010, 40(1), 186-197. |
[20]
.
In
| [20] | Zhang, T., Fang, B., Tang, Y, Y., Shang, Z., Xu, B. Generalized discriminant analysis: a matrix exponential approach. IEEE Trans, Syst, Man Cybern, B. 2010, 40(1), 186-197. |
[20]
, it was shown that the discriminant information of LDA is not lost even in EDA.
Thus, in the proposed LERDC model, discriminant performance of LDA is not decreased.
Furthermore, even if we project the scatter matrices into an exponential region, there is no significant change in the discriminant information of LDA.
That is why the LERDC can compare clustering performance with the LDMGI model.
As shown in
Table 1, the proposed LERDC is a local learning-based clustering model with parameters such as the LDMGI clustering model
| [17] | Yang, Y., Xu, D., Nie, F., Yan, S., Zhuang, Y. Image clustering using local discriminant models and global integration. IEEE Trans, Image Process. 2010, 19(10), 2761–2773. |
[17]
, when compared with previous local learning-based clustering methods
| [17] | Yang, Y., Xu, D., Nie, F., Yan, S., Zhuang, Y. Image clustering using local discriminant models and global integration. IEEE Trans, Image Process. 2010, 19(10), 2761–2773. |
| [18] | Nie, F., Zeng, Z., Tsang, I, W., Xu, D., Zhang, C. Spectral embedded clustering: a framework for in-sample and out-of-sample spectral clustering. IEEE Trans, Neural Netw. 2011, 22(11), 1796–1808. |
| [19] | Yu, S, X., Shi, J. Multiclass spectral clustering. International Conference on Computer Vision (ICCV), 2003, 313–339. |
[17-19]
.
4.5. Performance Variation of Previous Clustering Models
In this study, the optimal value of the clustering parameters
λ,
γ,
σ were selected from the set {10
−8, 10
−6, 10
−4, 10
−2, 10
0, 10
2, 10
4, 10
6, 10
8} as in
| [17] | Yang, Y., Xu, D., Nie, F., Yan, S., Zhuang, Y. Image clustering using local discriminant models and global integration. IEEE Trans, Image Process. 2010, 19(10), 2761–2773. |
[17]
.
Therefore, a total of nine observations for each image database are made in the previous clustering models (Ncut
| [19] | Yu, S, X., Shi, J. Multiclass spectral clustering. International Conference on Computer Vision (ICCV), 2003, 313–339. |
[19]
, SEC
| [18] | Nie, F., Zeng, Z., Tsang, I, W., Xu, D., Zhang, C. Spectral embedded clustering: a framework for in-sample and out-of-sample spectral clustering. IEEE Trans, Neural Netw. 2011, 22(11), 1796–1808. |
[18]
and LDMGI
| [17] | Yang, Y., Xu, D., Nie, F., Yan, S., Zhuang, Y. Image clustering using local discriminant models and global integration. IEEE Trans, Image Process. 2010, 19(10), 2761–2773. |
[17]
).
Tuning of clustering parameters for optimal clustering performance in all previous clustering models
| [17] | Yang, Y., Xu, D., Nie, F., Yan, S., Zhuang, Y. Image clustering using local discriminant models and global integration. IEEE Trans, Image Process. 2010, 19(10), 2761–2773. |
| [18] | Nie, F., Zeng, Z., Tsang, I, W., Xu, D., Zhang, C. Spectral embedded clustering: a framework for in-sample and out-of-sample spectral clustering. IEEE Trans, Neural Netw. 2011, 22(11), 1796–1808. |
| [19] | Yu, S, X., Shi, J. Multiclass spectral clustering. International Conference on Computer Vision (ICCV), 2003, 313–339. |
[17-19]
is required for each image database.
However, in contrast, such tuning is not required in the proposed LERDC clustering model.
5. Conclusion
We propose LERDC as a new local learning-based image clustering model.
In the LERDC model, the local scatter matrices in RDA are projected into the exponential domain.
Therefore, the small sample size problem of LDA is treated at the local level with the local scatter matrix added regularization parameter.
In the proposed LERDC model, k-nearest neighbors and λ is the clustering parameter as compared with existing local learning based clustering approaches.
Experimental results on ten reference image databases show that the proposed LERDC model is able to compare clustering performance with the RDA-based nearby competitor LDMGI model
| [17] | Yang, Y., Xu, D., Nie, F., Yan, S., Zhuang, Y. Image clustering using local discriminant models and global integration. IEEE Trans, Image Process. 2010, 19(10), 2761–2773. |
[17]
.
The clustering performance is comparable because the discriminant information of LDA is not lost even if the scatter matrix is projected onto the exponential domain.
We conclude that the proposed LERDC model is able to compare clustering performance with the same parameters as existing local learning based clustering methods.
In the future, we will investigate how to determine the optimal parameters and the appropriate discriminative image feature extraction methods to improve the clustering performance, together with using global information in addition to local information to effectively learn nonlinear manifolds in image data.
Abbreviations
ACC | Accuracy |
DisKmeans | Discriminant K-means |
EDA | Exponential Discriminant Analysis |
ELDE | Exponential Local Discriminant Embedding |
LERDC | Local Exponential Regularized Discriminant Clustering |
LERDM | Local Exponential Regularized Discriminant Model |
LDA | Linear Discriminant Analysis |
LDMGI | Local Discriminant Models and Global Integration |
Ncut | Normalized Cutting |
NMI | Normalized Mutual Information |
PCA | Principal Components Analysis |
RDA | Regularized Discriminant Analysis |
RLDA | Regularized Linear Discriminant Analysis |
SEC | Spectral Embedded Clustering |
SSS | Small-sample-size |
std | Standard Deviation |
Author Contributions
Kwang Jun Pak is the sole author. The author read and approved the final manuscript.
Conflicts of Interest
The authors declare no conflicts of interest.
References
| [1] |
Adil, M., Abid, M., Khan, A, Q., et al. Exponential discriminant analysis for fault diagnosis [J]. Neurocomputing. 2016, 171, 1344-1353.
|
| [2] |
Zhu, J., et al. Distributed parallel PCA for modeling and monitoring of large-scale plant-wide processes with big data [J]. IEEE Transactions on Industrial Informatics. 2017, 13(4), 1877-1885.
|
| [3] |
Yu, W., Zhao, C. Sparse exponential discriminant analysis and its application to fault diagnosis [J]. IEEE Transactions on Industrial Informatics. 2018, 65(7), 5931-5940.
|
| [4] |
Shuiwang, Ji., Jieping, Ye. Generalized Linear Discriminant Analysis: A Unified Framework and Efficient Model Selection. IEEE Transactions on Neural Network. Vol, 19., No, 10., October, 2008, 1768-1782.
|
| [5] |
la, Torre, F, D., Kanade, T. Discriminative cluster analysis. Int, Conf, on Machine Learning (ICML). 2006, 241–248.
|
| [6] |
Ding, C., Li, T. Adaptive dimension reduction using discriminant analysis and k-means clustering. Int, Conf, on Machine Learning (ICML). 2007, 521–528.
|
| [7] |
Ye, J., Zhao, Z., Wu, M. Discriminative k-means for clustering. Neural Information Processing System (NIPS). 2008, 1649–1656.
|
| [8] |
Fukunaga, K. Feature extraction and linear mapping for classification., in, Introduction to statistical pattern recognition. Ed, Rheinboldt, W. (Academic., San, Diego., CA. 1990, 2nd, edn).
|
| [9] |
Liu, K., et al. A generalized optimal set of discriminant vectors. Pattern Recognit. 1992, 25, 731–739.
|
| [10] |
Friedman, J, H. Regularized discriminant analysis. J, Am, Stat, Assoc. 1989, 84(405), 165–175.
|
| [11] |
Tebbens, J, D., Schlesinger, P. Improving implementation of linear discriminant analysis for the high dimension/small sample size problem. Comput, Stat, Data, Anal. 2007, 52, 423–437.
|
| [12] |
Howland, P., Wang, J., Park, H. Solving the small sample size problem in face recognition using generalized discriminant analysis. Pattern Recognit. 2006, 39, 277–287.
|
| [13] |
Wu, M., Scholkopf, B. A local learning approach for clustering. Neural Information Processing System (NIPS). 2006, 1529–1536.
|
| [14] |
Saul, L, K., Roweis, S, T. Think globally fit locally: unsupervised learning of low dimensional manifolds. J, Mach, Learn, Res. 2003, 4, 119–155.
|
| [15] |
Sugiyama, M. Dimensionality reduction of multimodal labeled data by local Fisher discriminant analysis. J, Mach, Learn, Res. 2007, 8, 1027–1061.
|
| [16] |
Shi, J., Malik, J. Normalized cuts and image segmentation. IEEE Trans, Pattern Anal, Mach, Intell. 2000, 22(8), 888–905.
|
| [17] |
Yang, Y., Xu, D., Nie, F., Yan, S., Zhuang, Y. Image clustering using local discriminant models and global integration. IEEE Trans, Image Process. 2010, 19(10), 2761–2773.
|
| [18] |
Nie, F., Zeng, Z., Tsang, I, W., Xu, D., Zhang, C. Spectral embedded clustering: a framework for in-sample and out-of-sample spectral clustering. IEEE Trans, Neural Netw. 2011, 22(11), 1796–1808.
|
| [19] |
Yu, S, X., Shi, J. Multiclass spectral clustering. International Conference on Computer Vision (ICCV), 2003, 313–339.
|
| [20] |
Zhang, T., Fang, B., Tang, Y, Y., Shang, Z., Xu, B. Generalized discriminant analysis: a matrix exponential approach. IEEE Trans, Syst, Man Cybern, B. 2010, 40(1), 186-197.
|
| [21] |
Dornaika, F., Bosaghzadeh, A. Exponential local discriminant embedding and its application to face recognition. IEEE Trans, Cybern. 2013, 43(3), 921–934.
|
| [22] |
Nasir, Ahmed. Image clustering using exponential discriminant analysis. IET Comput, Vis. 2015, Vol, 9, Iss, 1, 1–12.
|
| [23] |
Higham, N, J. Functions of matrices: theory and computation. Society for Industrial and Applied Mathematics. Philadelphia, PA, USA, 2008.
|
| [24] |
Williamson, R. Introduction to differential equations. Prentice-Hall, Englewood Cliffs, NJ. 1986.
|
| [25] |
MATLAB, version 7.10.0 (R2011a). The MathWorks Inc, Natick, MA. 2011.
|
| [26] |
Duda, R., Hart, P., Stroke, D. Pattern classification. Wiley. 2007, 2nd, edn.
|
| [27] |
Li, F., Andreetto, M., Ranzato, M, A. Caltech101. Computational Vision Group, California Institute of Technology. 2003. Available at,
http://www.vision.caltech.edu/ImageDatasets/Caltech101
|
| [28] |
Weber, M. Frontal face dataset. Computational Vision Group, California Institute of Technology. 2012. Available at,
http://www.
vision.caltech.edu/html-files/archive.html
|
| [29] |
Nene, S, A., Nayar, S, K., Murase, H. Columbia Object Image Library (Coil-20). 1996.
|
| [30] |
Xu, D., Yan, S., Tao, D., Lin, S., Zhang, H., Huang, T. Reconstruction and recognition of tensor-based objects with concurrent subspaces analysis. IEEE Trans, Circuits Syst, Video Technol. 2008, 18(1), 36–47.
|
| [31] |
Tao, D. The COREL Database for content based image retrieval. 2009. Available at,
https://sites.google.com/site/dctresearch/Home/content-based-image-retrieval
|
| [32] |
Lyons, M, J., Budynek, J., Akamatsu, S. Automatic classification of single facial images. IEEE Trans, Pattern Anal, Mach, Intell. 1999, 21(12), 1357–1362.
|
| [33] |
Bicegoa, M., Murinoa, V., Figueiredob, M, A. Similarity-based classification of sequences using hidden Markov models. Pattern Recognit. 2004, 37(12), 2281–2291.
|
| [34] |
Thakoor, N., Gao, J., Jung, S. Hidden Markov model-based weighted likelihood discriminant for 2-d shape classification. IEEE Trans, Image Process. 2007, 16(11), 2707–2719.
|
| [35] |
Samaria, F., Harter, A. Parameterisation of a stochastic model for human face identification. Proc, 2nd IEEE Workshop on Applications of Computer Vision. 1994, 138–142.
|
| [36] |
Gourier, N., Hall, D., Crowley, J, L. Estimating face orientation from robust detection of salient facial features. Int, Workshop on Visual Observation of Deictic Gestures (ICPR). 2004, 17–25.
|
| [37] |
Oliva, A., Torralba, A. Modeling the shape of the scene: a holistic representation of the spatial envelope. Int, J, Comput, Vis. 2001. 42(3), 145–175.
|
| [38] |
Belhumeur, P, N., Hespanha, J, P., Kriegman, D, J. Eigenfaces vs. fisherfaces: recognition using class specific linear projection. IEEE Trans, Pattern Anal, Mach, Intell. 1997, 19(7), 711–720.
|
| [39] |
Papadimitriou, C, H., Steiglitz, K. Combinatorial optimization: algorithms and complexity. Dover, New York. 1998.
|
| [40] |
Zhu, H., Zhou, M., Alkins, R. Group role assignment via a Kuhn-Munkres algorithm-based solution. IEEE Trans, Syst, Man Cybern, A. 2012, 42(3), 739–750.
|
| [41] |
Wang, F., Zhang, C. Clustering with local and global regularization. IEEE Trans, Knowl, Data Eng. 2009, 21(12), 1665–1678.
|
| [42] |
Ahmed, N., Jalil, A. Multimode image clustering using optimal image descriptor. IEICE Trans, Inf, Syst. 2014, E97-D (4), 743–751.
|
Cite This Article
-
APA Style
Pak, K. J. (2026). Image Clustering Using Exponential Regularized Discriminant Analysis. International Journal of Theoretical and Applied Mathematics, 12(1), 1-12. https://doi.org/10.11648/j.ijtam.20261201.11
 Copy
|
Copy
|
 Download
ACS Style
Pak, K. J. Image Clustering Using Exponential Regularized Discriminant Analysis. Int. J. Theor. Appl. Math. 2026, 12(1), 1-12. doi: 10.11648/j.ijtam.20261201.11
Copy
|
Download
AMA Style
Pak KJ. Image Clustering Using Exponential Regularized Discriminant Analysis. Int J Theor Appl Math. 2026;12(1):1-12. doi: 10.11648/j.ijtam.20261201.11
Copy
|
Download
-
@article{10.11648/j.ijtam.20261201.11,
  author = {Kwang Jun Pak},
  title = {Image Clustering Using Exponential Regularized Discriminant Analysis},
  journal = {International Journal of Theoretical and Applied Mathematics},
  volume = {12},
  number = {1},
  pages = {1-12},
  doi = {10.11648/j.ijtam.20261201.11},
  url = {https://doi.org/10.11648/j.ijtam.20261201.11},
  eprint = {https://article.sciencepublishinggroup.com/pdf/10.11648.j.ijtam.20261201.11},
  abstract = {When clustering images, the images are typically sampled as nonlinear manifolds. In this case, local learning-based image clustering models are used. Several proposed clustering models are based on linear discriminant analysis (LDA). In image clustering based on linear discriminant analysis (LDA), the problem of small-sample-size (SSS) is presented when the dimensionality of image data is larger than the number of samples. To solve this problem, various image clustering models based on local learning have been introduced. In the proposed clustering models, we added tuning parameters to deal with the small-sample-size (SSS) problem arising in linear discriminant analysis (LDA). In this paper, we propose an exponential regularized discriminant clustering model as an image clustering model based on local learning. In the proposed local exponentially regularized discriminant clustering (LERDC) model, the local scattering matrices of the regularized discriminant model are projected into the exponential domain to address the SSS problem of LDA. Compared with previous clustering methods based on local learning, k-nearest neighbors and regularization parameter λ in the local exponentially regularized discriminant clustering model are the tuning parameters for clustering. The experiments are concluded that the clustering performance of the proposed LERDC model is comparable to that of the clustering methods based on previous local learning.},
 year = {2026}
}
Copy
|
Download
-
TY  - JOUR
T1  - Image Clustering Using Exponential Regularized Discriminant Analysis
AU  - Kwang Jun Pak
Y1  - 2026/01/26
PY  - 2026
N1  - https://doi.org/10.11648/j.ijtam.20261201.11
DO  - 10.11648/j.ijtam.20261201.11
T2  - International Journal of Theoretical and Applied Mathematics
JF  - International Journal of Theoretical and Applied Mathematics
JO  - International Journal of Theoretical and Applied Mathematics
SP  - 1
EP  - 12
PB  - Science Publishing Group
SN  - 2575-5080
UR  - https://doi.org/10.11648/j.ijtam.20261201.11
AB  - When clustering images, the images are typically sampled as nonlinear manifolds. In this case, local learning-based image clustering models are used. Several proposed clustering models are based on linear discriminant analysis (LDA). In image clustering based on linear discriminant analysis (LDA), the problem of small-sample-size (SSS) is presented when the dimensionality of image data is larger than the number of samples. To solve this problem, various image clustering models based on local learning have been introduced. In the proposed clustering models, we added tuning parameters to deal with the small-sample-size (SSS) problem arising in linear discriminant analysis (LDA). In this paper, we propose an exponential regularized discriminant clustering model as an image clustering model based on local learning. In the proposed local exponentially regularized discriminant clustering (LERDC) model, the local scattering matrices of the regularized discriminant model are projected into the exponential domain to address the SSS problem of LDA. Compared with previous clustering methods based on local learning, k-nearest neighbors and regularization parameter λ in the local exponentially regularized discriminant clustering model are the tuning parameters for clustering. The experiments are concluded that the clustering performance of the proposed LERDC model is comparable to that of the clustering methods based on previous local learning.
VL  - 12
IS  - 1
ER  -
Copy
|
Download